The interesting part about education is that we have a lot of qualitative data that is difficult to apply a value to. Compared to the straightforward measurement of “on base percentage” in baseball, applying a value to the affect of teacher-student interactions on achievement is difficult.
The biggest question I’ve been asking myself lately is, “What data can we use that is easy to gather and easy to understand?” In order to have an impact, people need to see themselves in the data. For example, if we have a student who has been absent for 20 days of school, everyone knows what that means. What is more difficult to analyze is the reason why they missed those 20 days.
Over the course of the past couple of weeks I’ve made a break through in my thinking. I’ve come to the realization that we need to use the quantitative data to talk about the qualitative factors.
For example lets examine the following graphs.
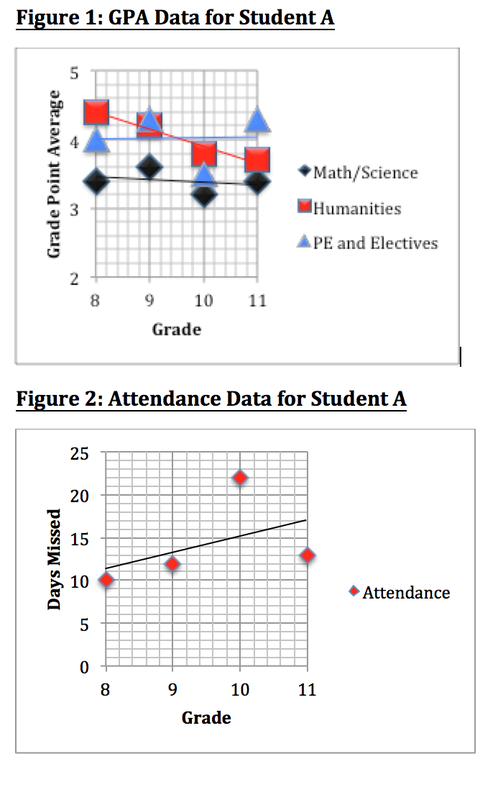
What the data shows is an overall decrease in GPA in Math/Science and Humanities and a slight increase in PE/Electives. The data also indicates an increase in the number of days missed for this student as they have progressed through to grade 11. We could take this data and project or extrapolate it to predict that this student would continue to see their grades fall in the Humanities and Math/Science areas. We could also predict that their days missed would increase. There are hundreds of questions and conversations that could come from simply looking at these two graphs.
The biggest questions that my colleague Chris Horton and I have with this data are:
For Student A above, if we projected that student A would have a GPA of 3.3 in their humanities classes and would miss 18 days of classes could we change the conversation about the student if we said …
“Student A, we have projected you to have a humanities GPA of 3.3 and you are going to miss 18 days of classes. A 20% positive change in your attendance and achievement is an attainable goal so we are setting new targets for you. Your new target is a 3.96 GPA in humanities and 14.4 days missed of classes and here are the supports we know you need and we can offer … what else do you as a learner need to be successful?”
Our ability to impact these goals is based in the qualitative arena via the conversations we are having with teachers and students. There are two areas of growth we are focusing on in our school and these would drive these conversations and change the narrative around student achievement.
Climate and culture are our focus at DCSS this year, so what would our school look like a year from now if our conversations about student achievement focused on helping students to reach these targets through the support of our teachers in the areas of formative assessment, teacher-student relationships and feedback?
Could this approach be the “on base percentage” breakthrough we’ve been looking for?
Time will tell.
The biggest questions that my colleague Chris Horton and I have with this data are:
- If we extrapolated historical data to predict the outcome of the current school year for the student, could we positively impact the trends we see?
- If we set targets for the students that are above their current trend, would the students strive to meet those targets?
- What conversations could we have with our students, staff and parents to positively impact the learning of all students in our buildings?
For Student A above, if we projected that student A would have a GPA of 3.3 in their humanities classes and would miss 18 days of classes could we change the conversation about the student if we said …
“Student A, we have projected you to have a humanities GPA of 3.3 and you are going to miss 18 days of classes. A 20% positive change in your attendance and achievement is an attainable goal so we are setting new targets for you. Your new target is a 3.96 GPA in humanities and 14.4 days missed of classes and here are the supports we know you need and we can offer … what else do you as a learner need to be successful?”
Our ability to impact these goals is based in the qualitative arena via the conversations we are having with teachers and students. There are two areas of growth we are focusing on in our school and these would drive these conversations and change the narrative around student achievement.
Climate and culture are our focus at DCSS this year, so what would our school look like a year from now if our conversations about student achievement focused on helping students to reach these targets through the support of our teachers in the areas of formative assessment, teacher-student relationships and feedback?
Could this approach be the “on base percentage” breakthrough we’ve been looking for?
Time will tell.
 RSS Feed